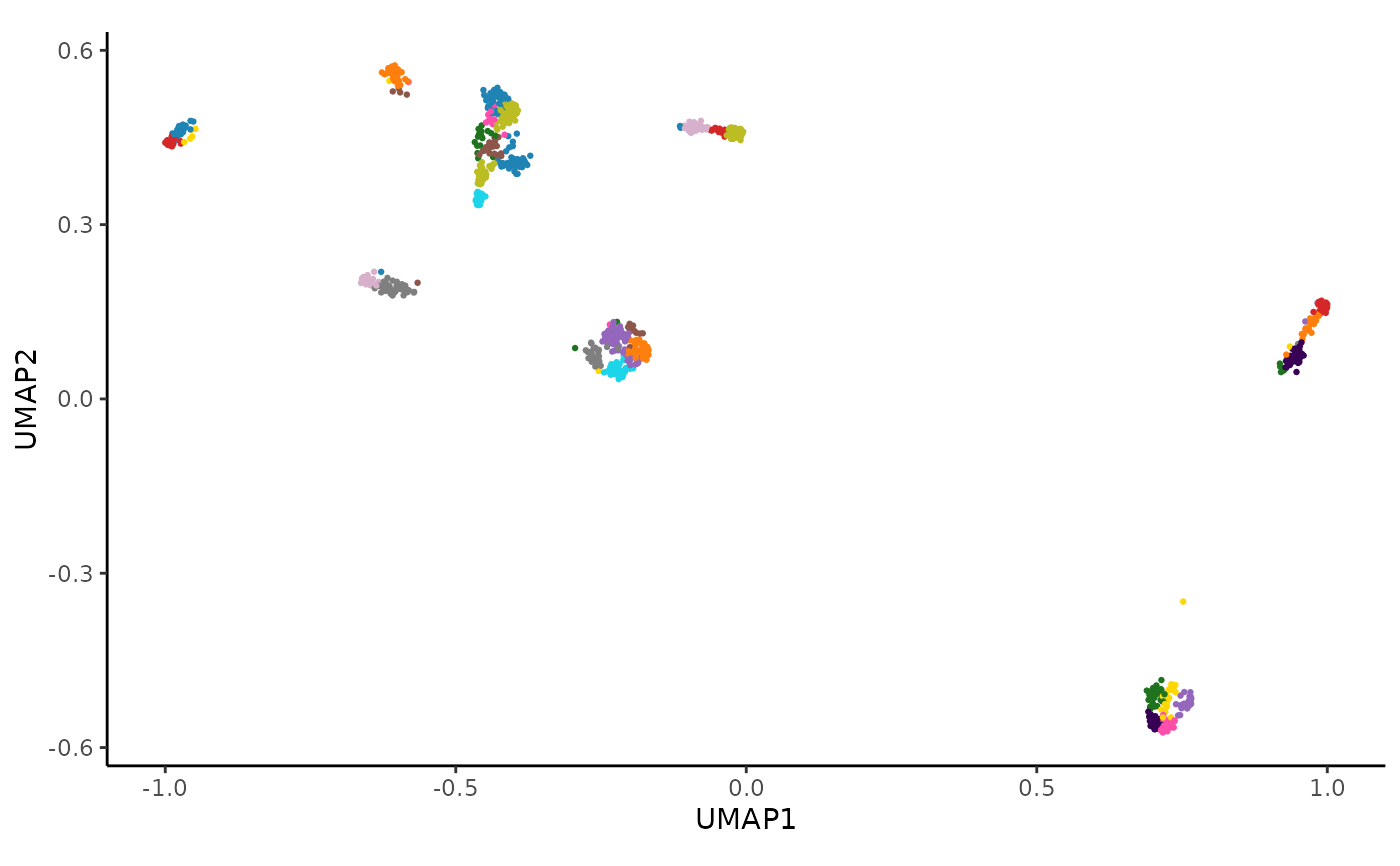
hc_plot_umap() creates a UMAP plot from an AnnData object, displaying points, cluster hulls, or both.
Usage
hc_plot_umap(AnnDatR, plot = c("points", "hulls", "both"))Examples
# Plot UMAP points from an AnnDatR object
adata_res <- hc_pca(example_adata, components = 40)
adata_res <- hc_distance(adata_res, components = 20)
adata_res <- hc_snn(adata_res, neighbors = 15)
#> Building SNN based on a provided distance matrix
#> Computing SNN
adata_res <- hc_cluster_consensus(adata_res, resolution = 7)
#> Iteration: 0 *** value: 948.279
#> Iteration: 1 *** value: 70.5063
#> Iteration: 2 *** value: 22.246
#> Iteration: 3 *** value: 22.2447
#> Iteration: 4 *** value: 22.2447
#> Minimum: 22.2447
#> Joining with `by = join_by(cons_cluster)`
adata_res <- hc_umap(adata_res)
adata_res <- hc_cluster_hulls(adata_res)
hc_plot_umap(adata_res)